A plain-language guide to volatility, drawdowns and the risks a price chart does not show.
An Etesia primer. Reading time: about 10 minutes.
Picture two investments of 10,000. Ten years later, each is worth 15,000. On paper they earned the same return, but one of them lost half its value on the way.
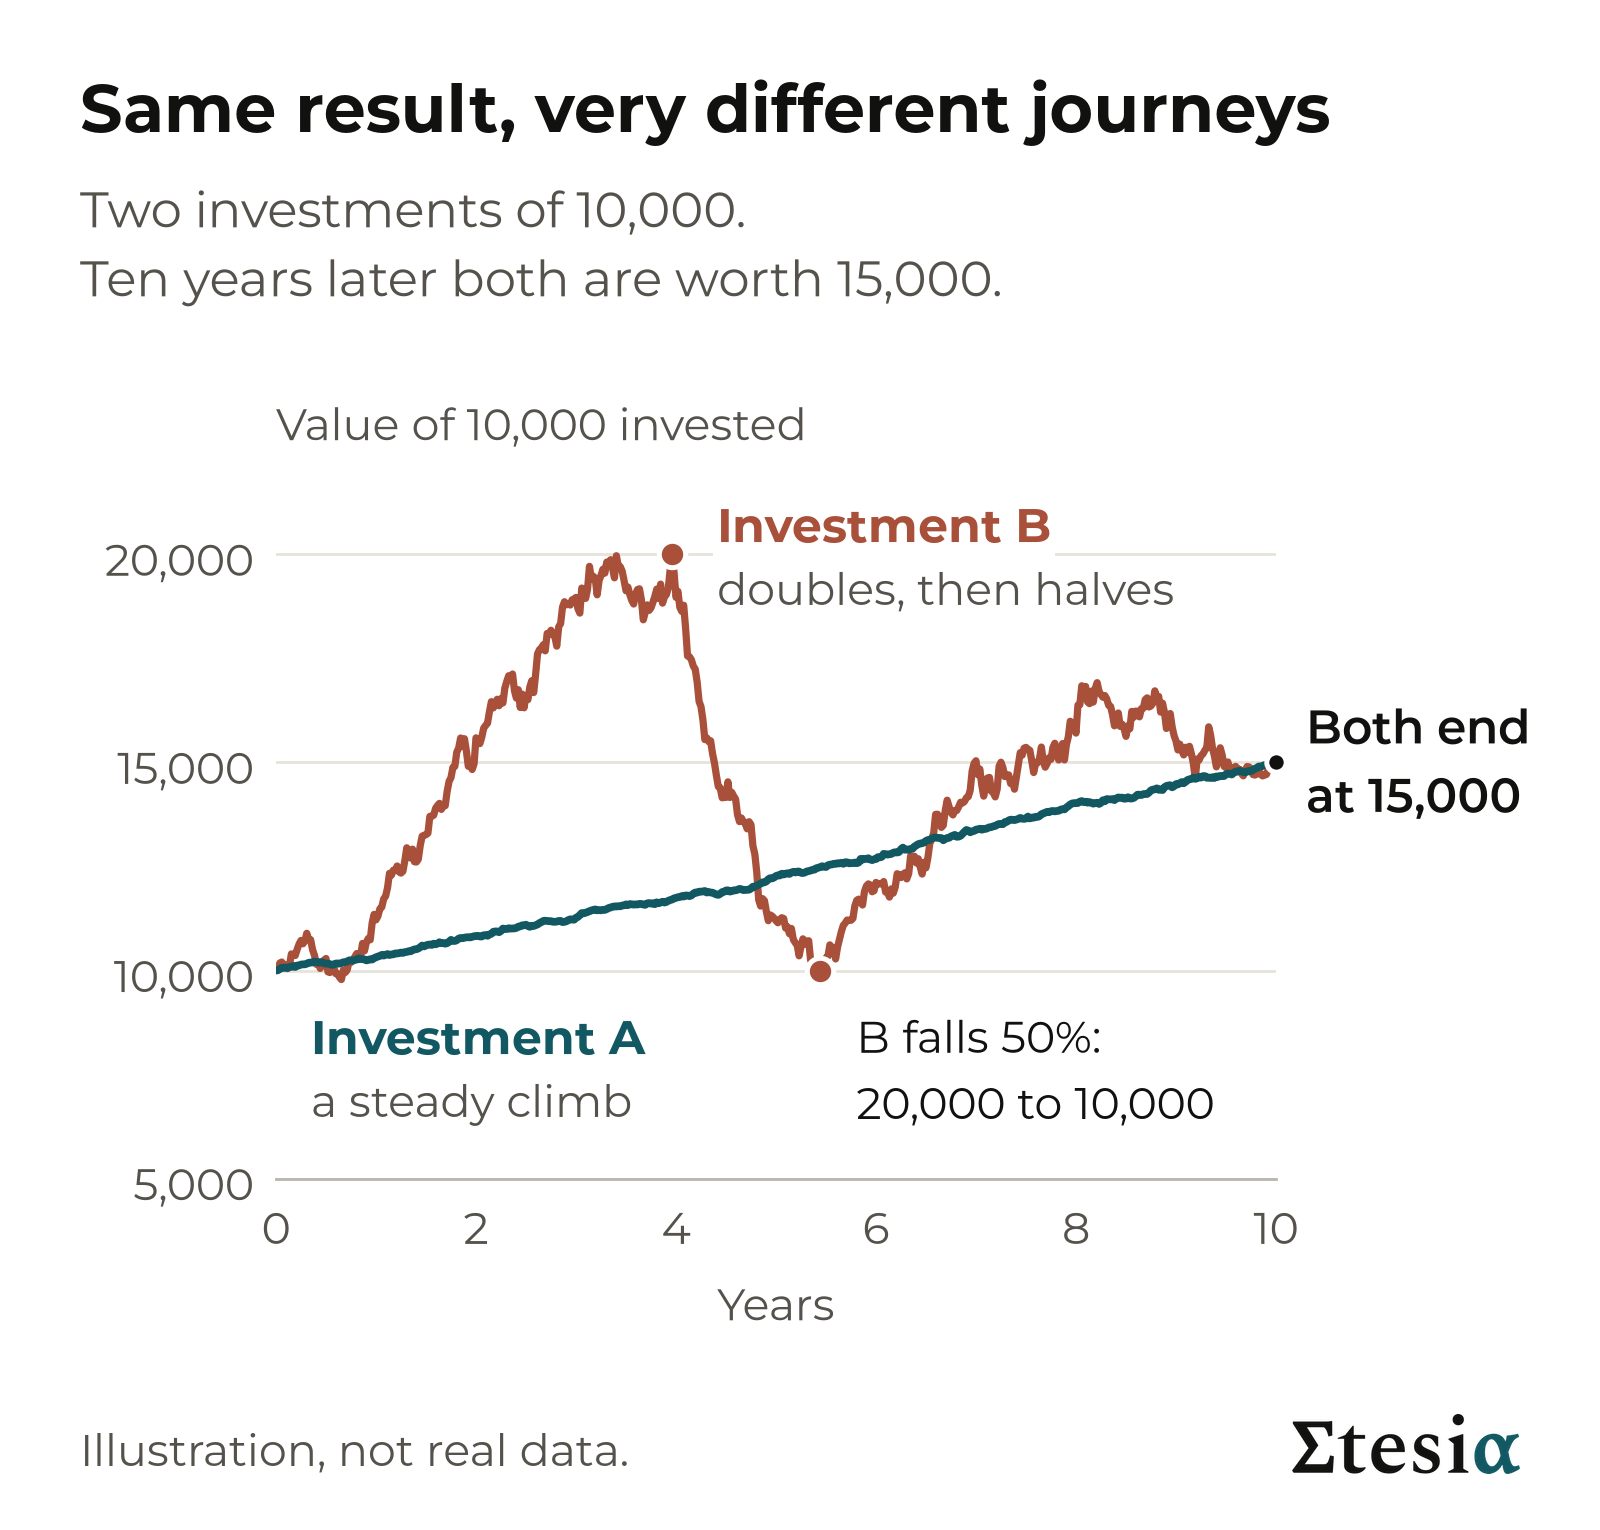
The first climbed steadily. The second doubled, then fell by half, and climbed back unevenly. Had you held it, you would have watched 10,000 disappear in about eighteen months, with no way of knowing it would come back. That is the moment many people sell.
Return tells you where you ended up. Risk tells you what you went through to get there. Most adverts talk about the first. This primer is about the second.
Takeaway: two investments with the same return can be very different to live with.
What risk is
Risk is the chance that things turn out differently from what you expected. Above all, it is the chance of losing money you cannot afford to lose.
Any return above what a savings account offers is a payment for carrying some uncertainty. The reverse does not hold: taking a risk does not guarantee a return, and some risks (fraud, a failed platform, a software bug) pay nothing at all.
So the useful question is not “is this risky?” It is “which risk, how much of it, and what am I paid for it?”
Some risk shows on a price chart and some does not. We start with what shows.
Takeaway: return above a savings rate always comes with risk, but risk does not always come with return. Know which risks you hold.
Volatility: how bumpy the ride is
Volatility measures how much the value of an investment moves up and down along the way. It is quoted as a percentage per year: the typical size of a year’s swing, up or down.
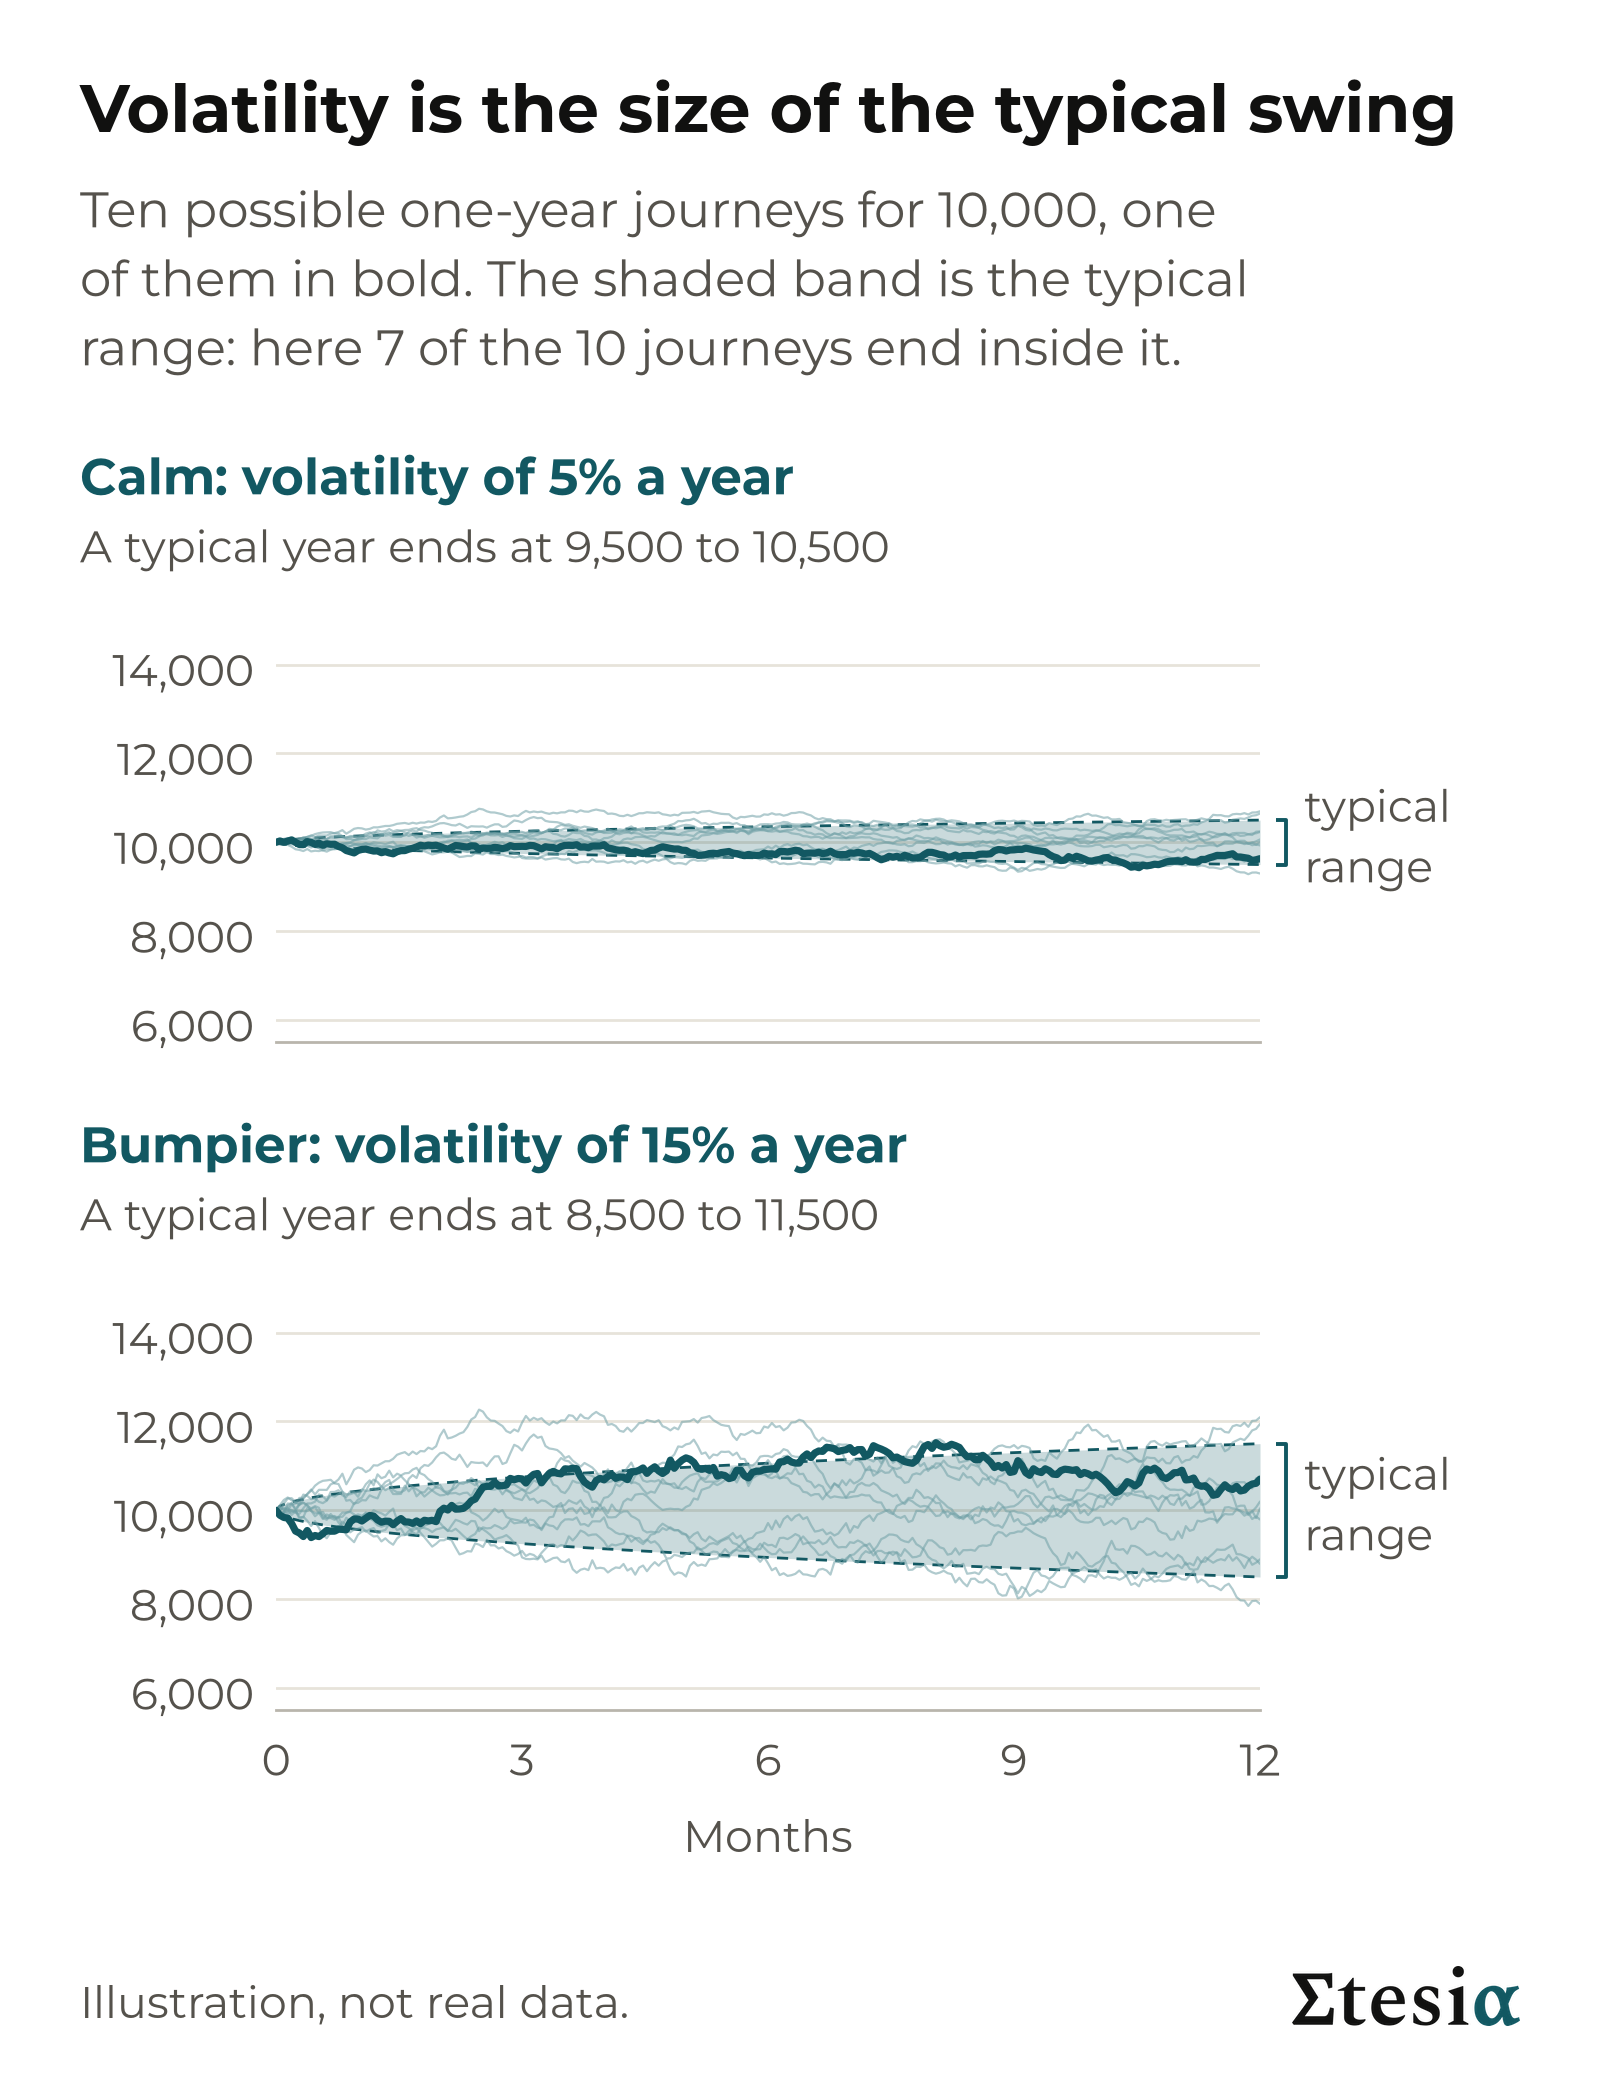
A rule of thumb: put 10,000 into something with a volatility of 15%. In about seven years out of ten it ends the year between 8,500 and 11,500, before counting any growth. In the other three it lands outside, and real markets produce extreme years more often than the rule suggests. The range describes the past, not a limit.
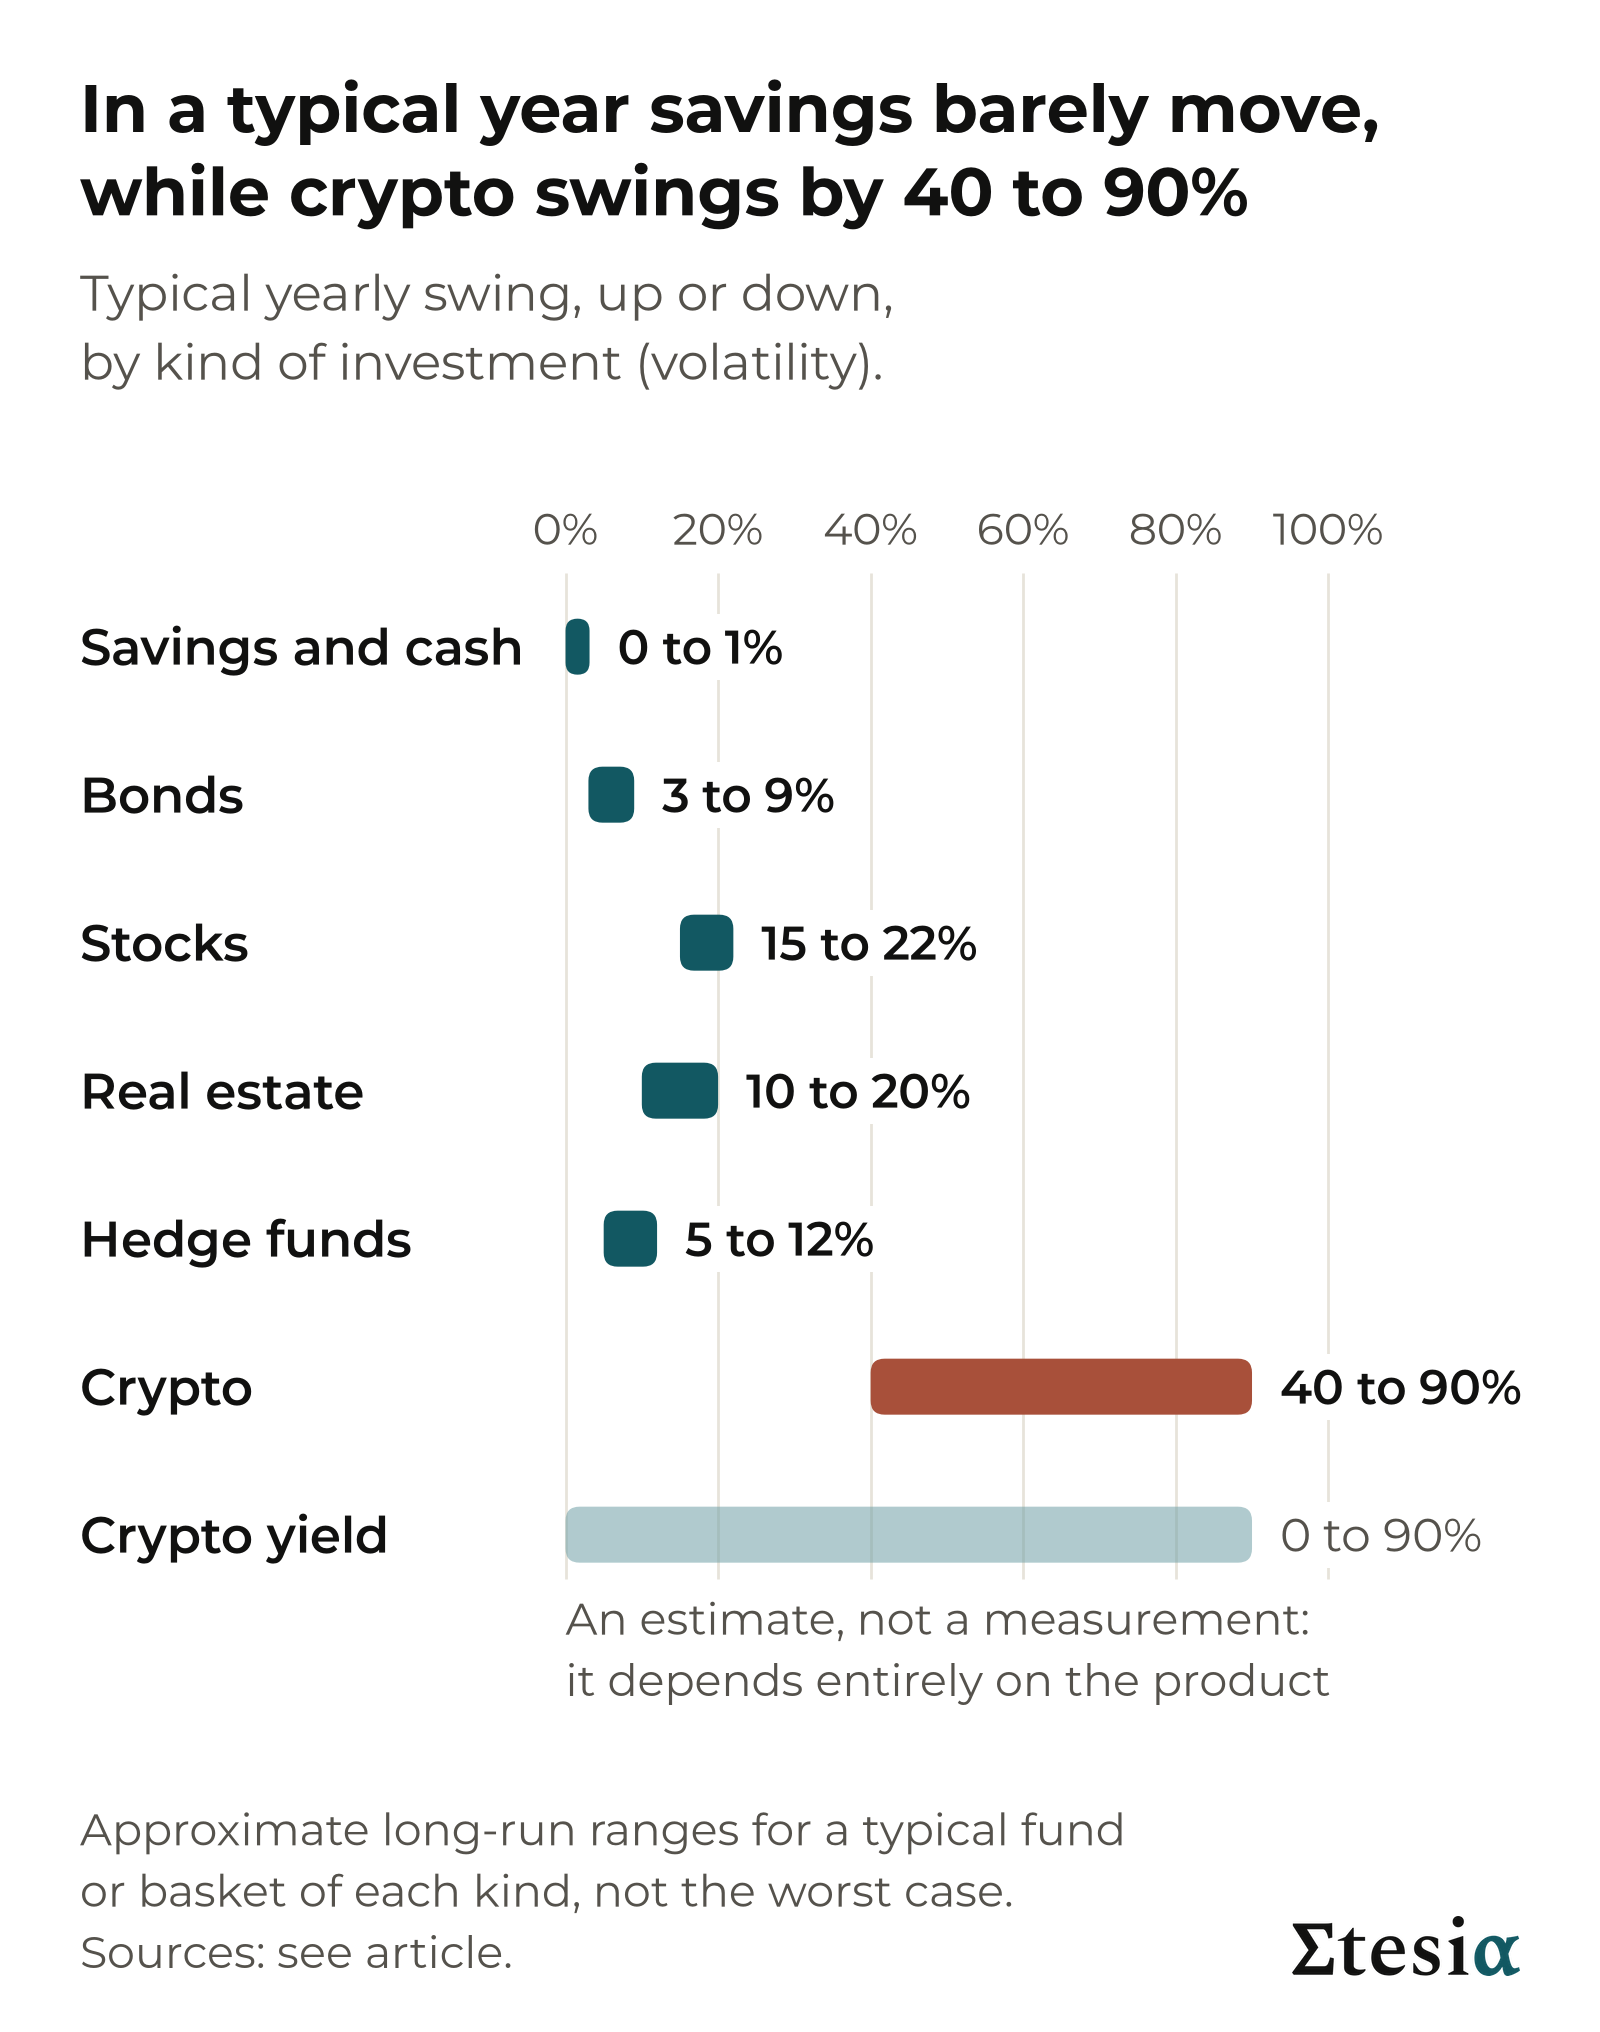
The spread is wide: from 1% or less for savings to 40 to 90% for crypto.
Volatility misses three things. It counts a swing up like a swing down, though only one hurts. It describes a typical year, not the worst one. And it only sees what shows in the price. A building is not priced every day: an expert values it from time to time, so on paper it looks calm. Between September 2008 and February 2009, US property measured that way fell 15%. Property funds traded daily on the stock market, which also carry debt, fell 60%.
Takeaway: volatility tells you how rough a normal year is, not how bad a bad year can get.
Drawdown: the number you actually feel
A drawdown is the fall from a high point to the low that follows, and the maximum drawdown is the deepest one in an investment’s history. Two things matter: how deep the fall is, and how long you wait to see your old high again, known as time under water.
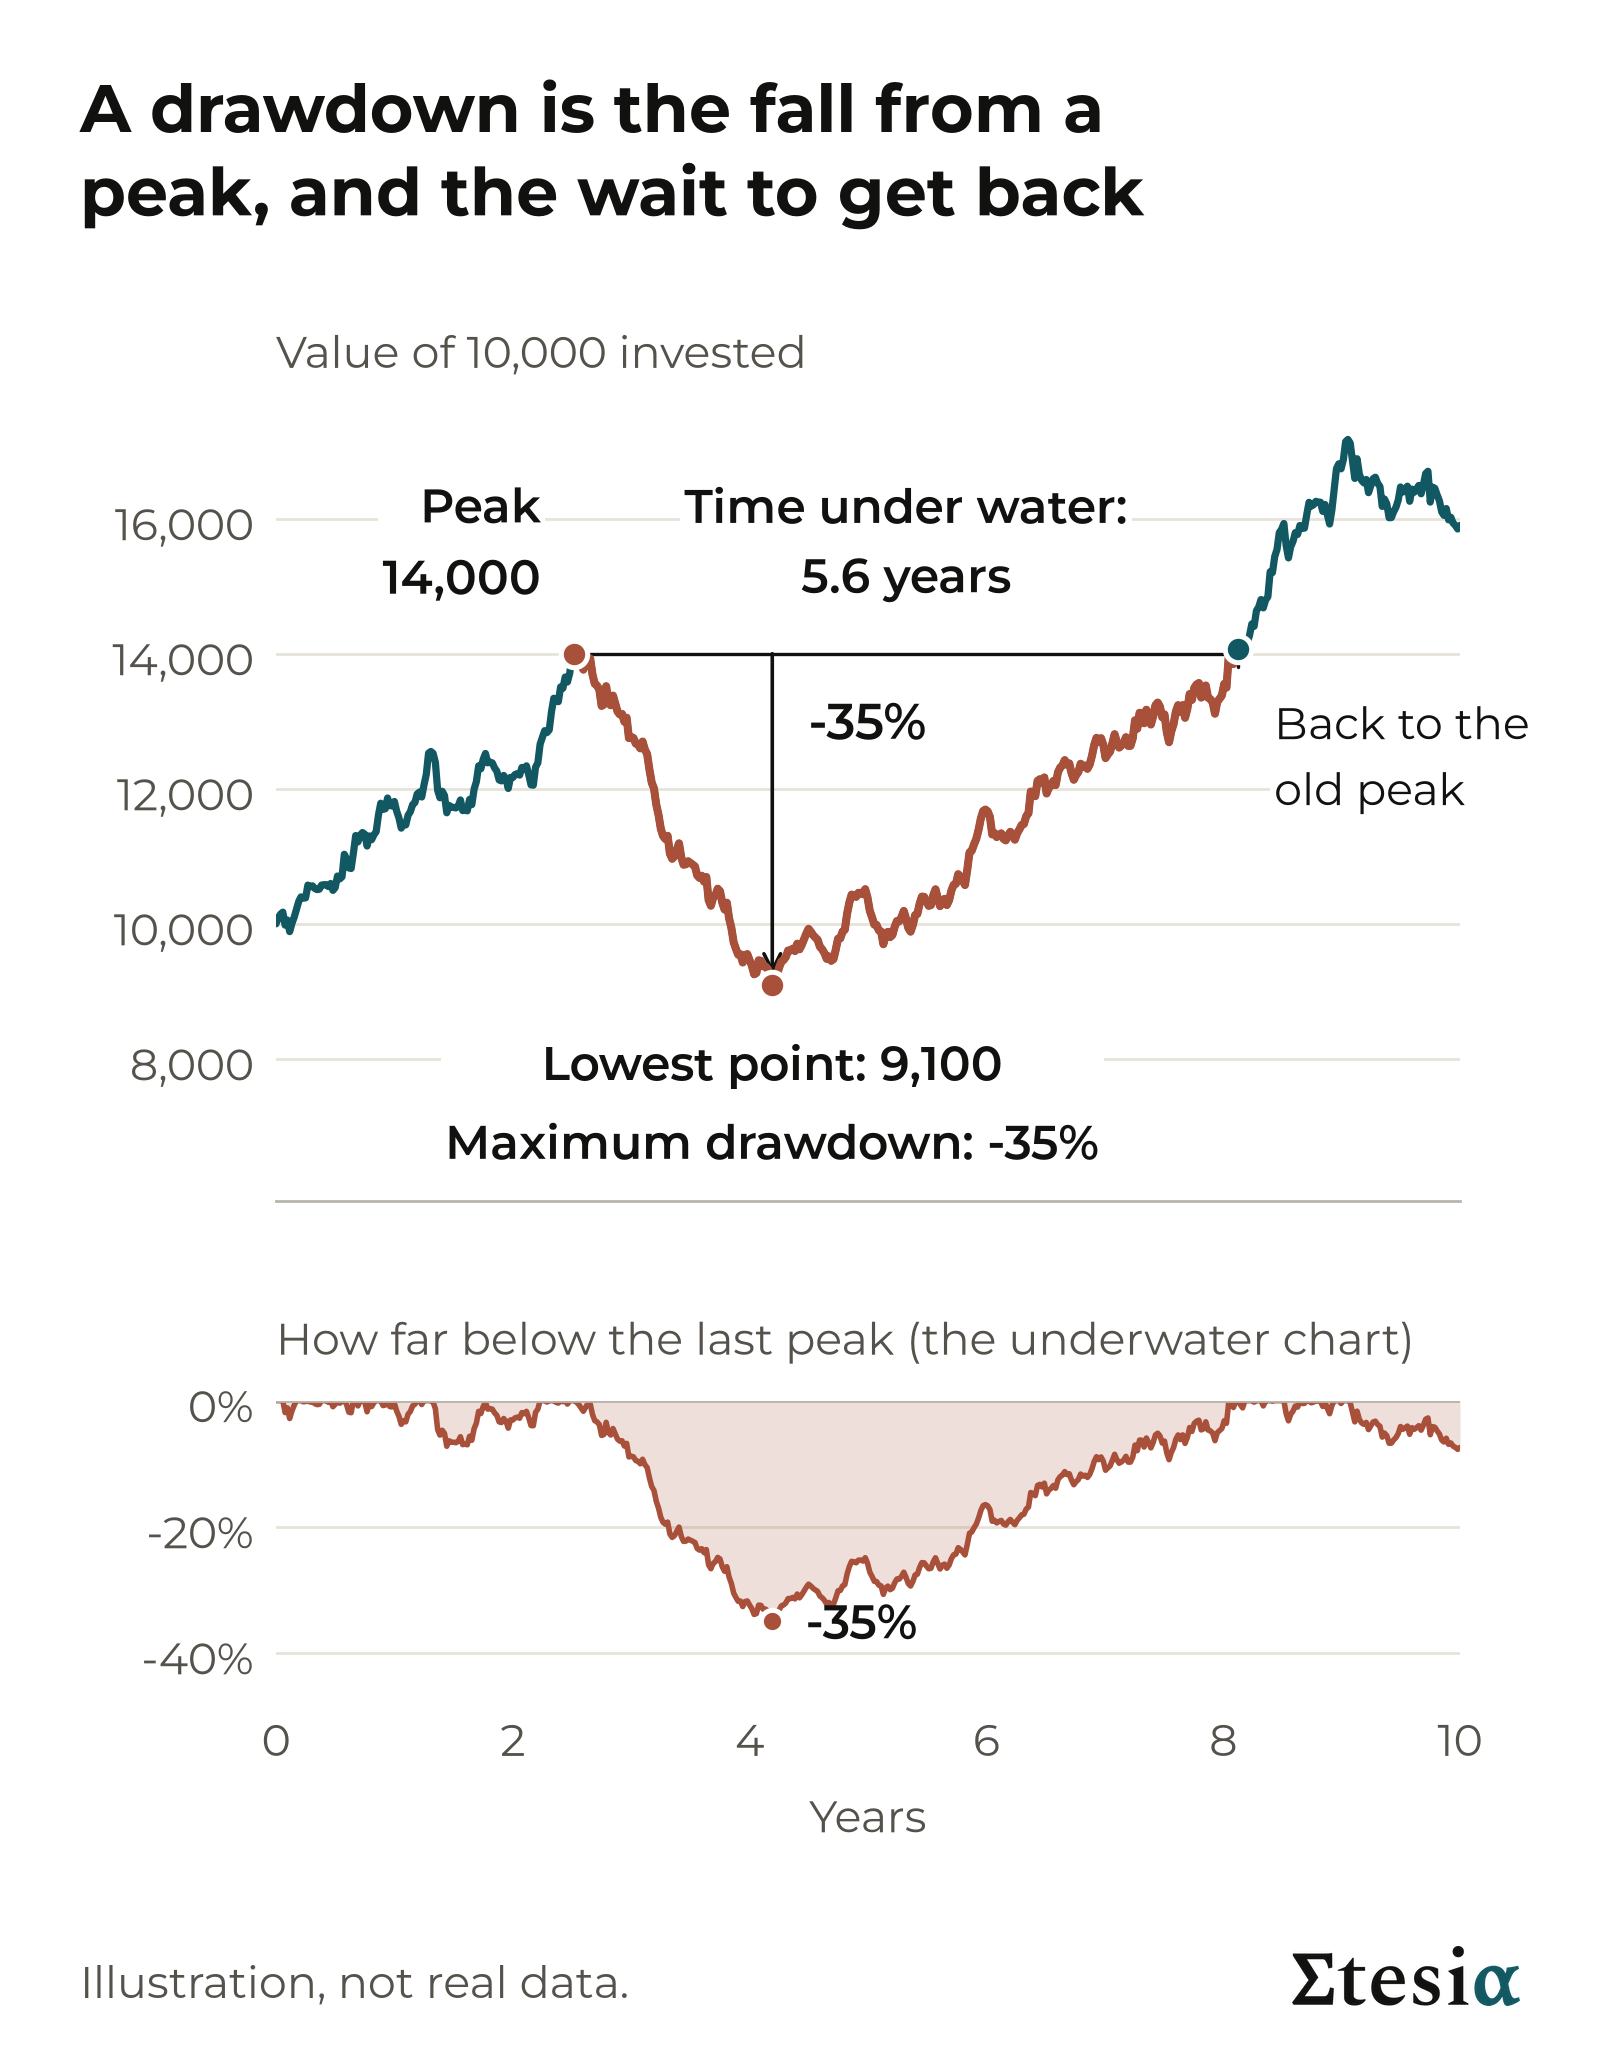
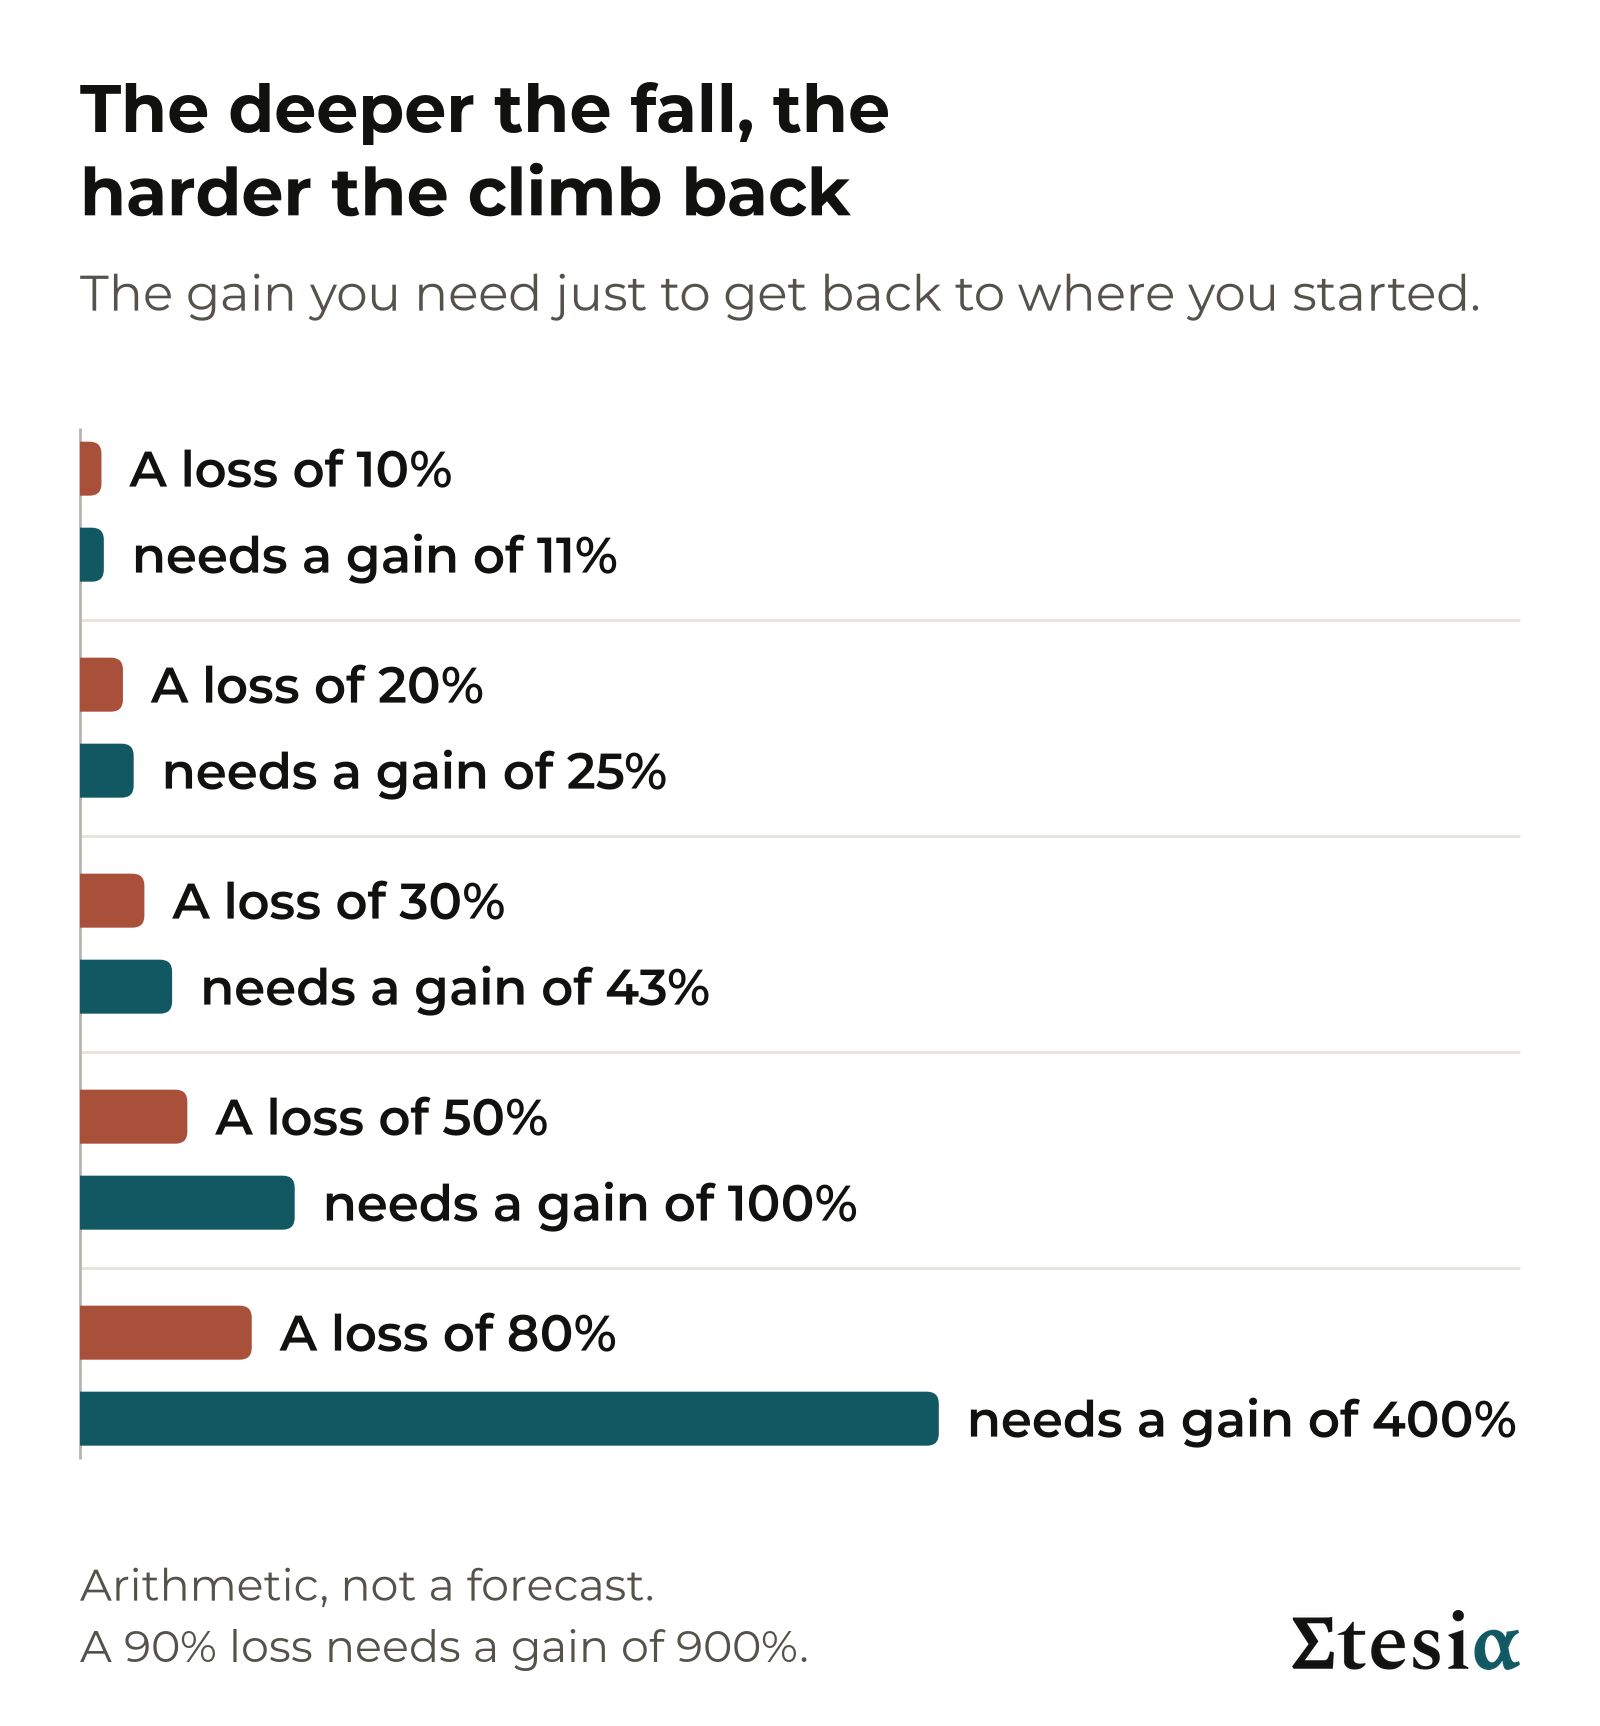
Your 10,000 falls to 8,000: a 20% drawdown. To get back you must earn 2,000 on the 8,000 you have left: a gain of 25%, not 20%. The climb is always steeper than the fall, because it starts from a smaller sum. Lose 50% and you need 100%: your money has to double. Lose 80% and you need 400%.
The wait can be long. The S&P 500, an index of 500 large US companies (an index tracks the average price of a group of investments), fell about 57% between October 2007 and March 2009. On prices alone, it took about five and a half years from its peak to get back.
Drawdown is the number people feel, because it is measured in money they once had. Selling at the low makes the loss permanent. But holding on is not a guarantee either: some investments take many years to come back, and some never do.
Takeaway: ask how deep an investment has fallen and how long it stayed down.
The risks you cannot see on a price chart
Most of the risks below can sit behind a chart that still looks calm.
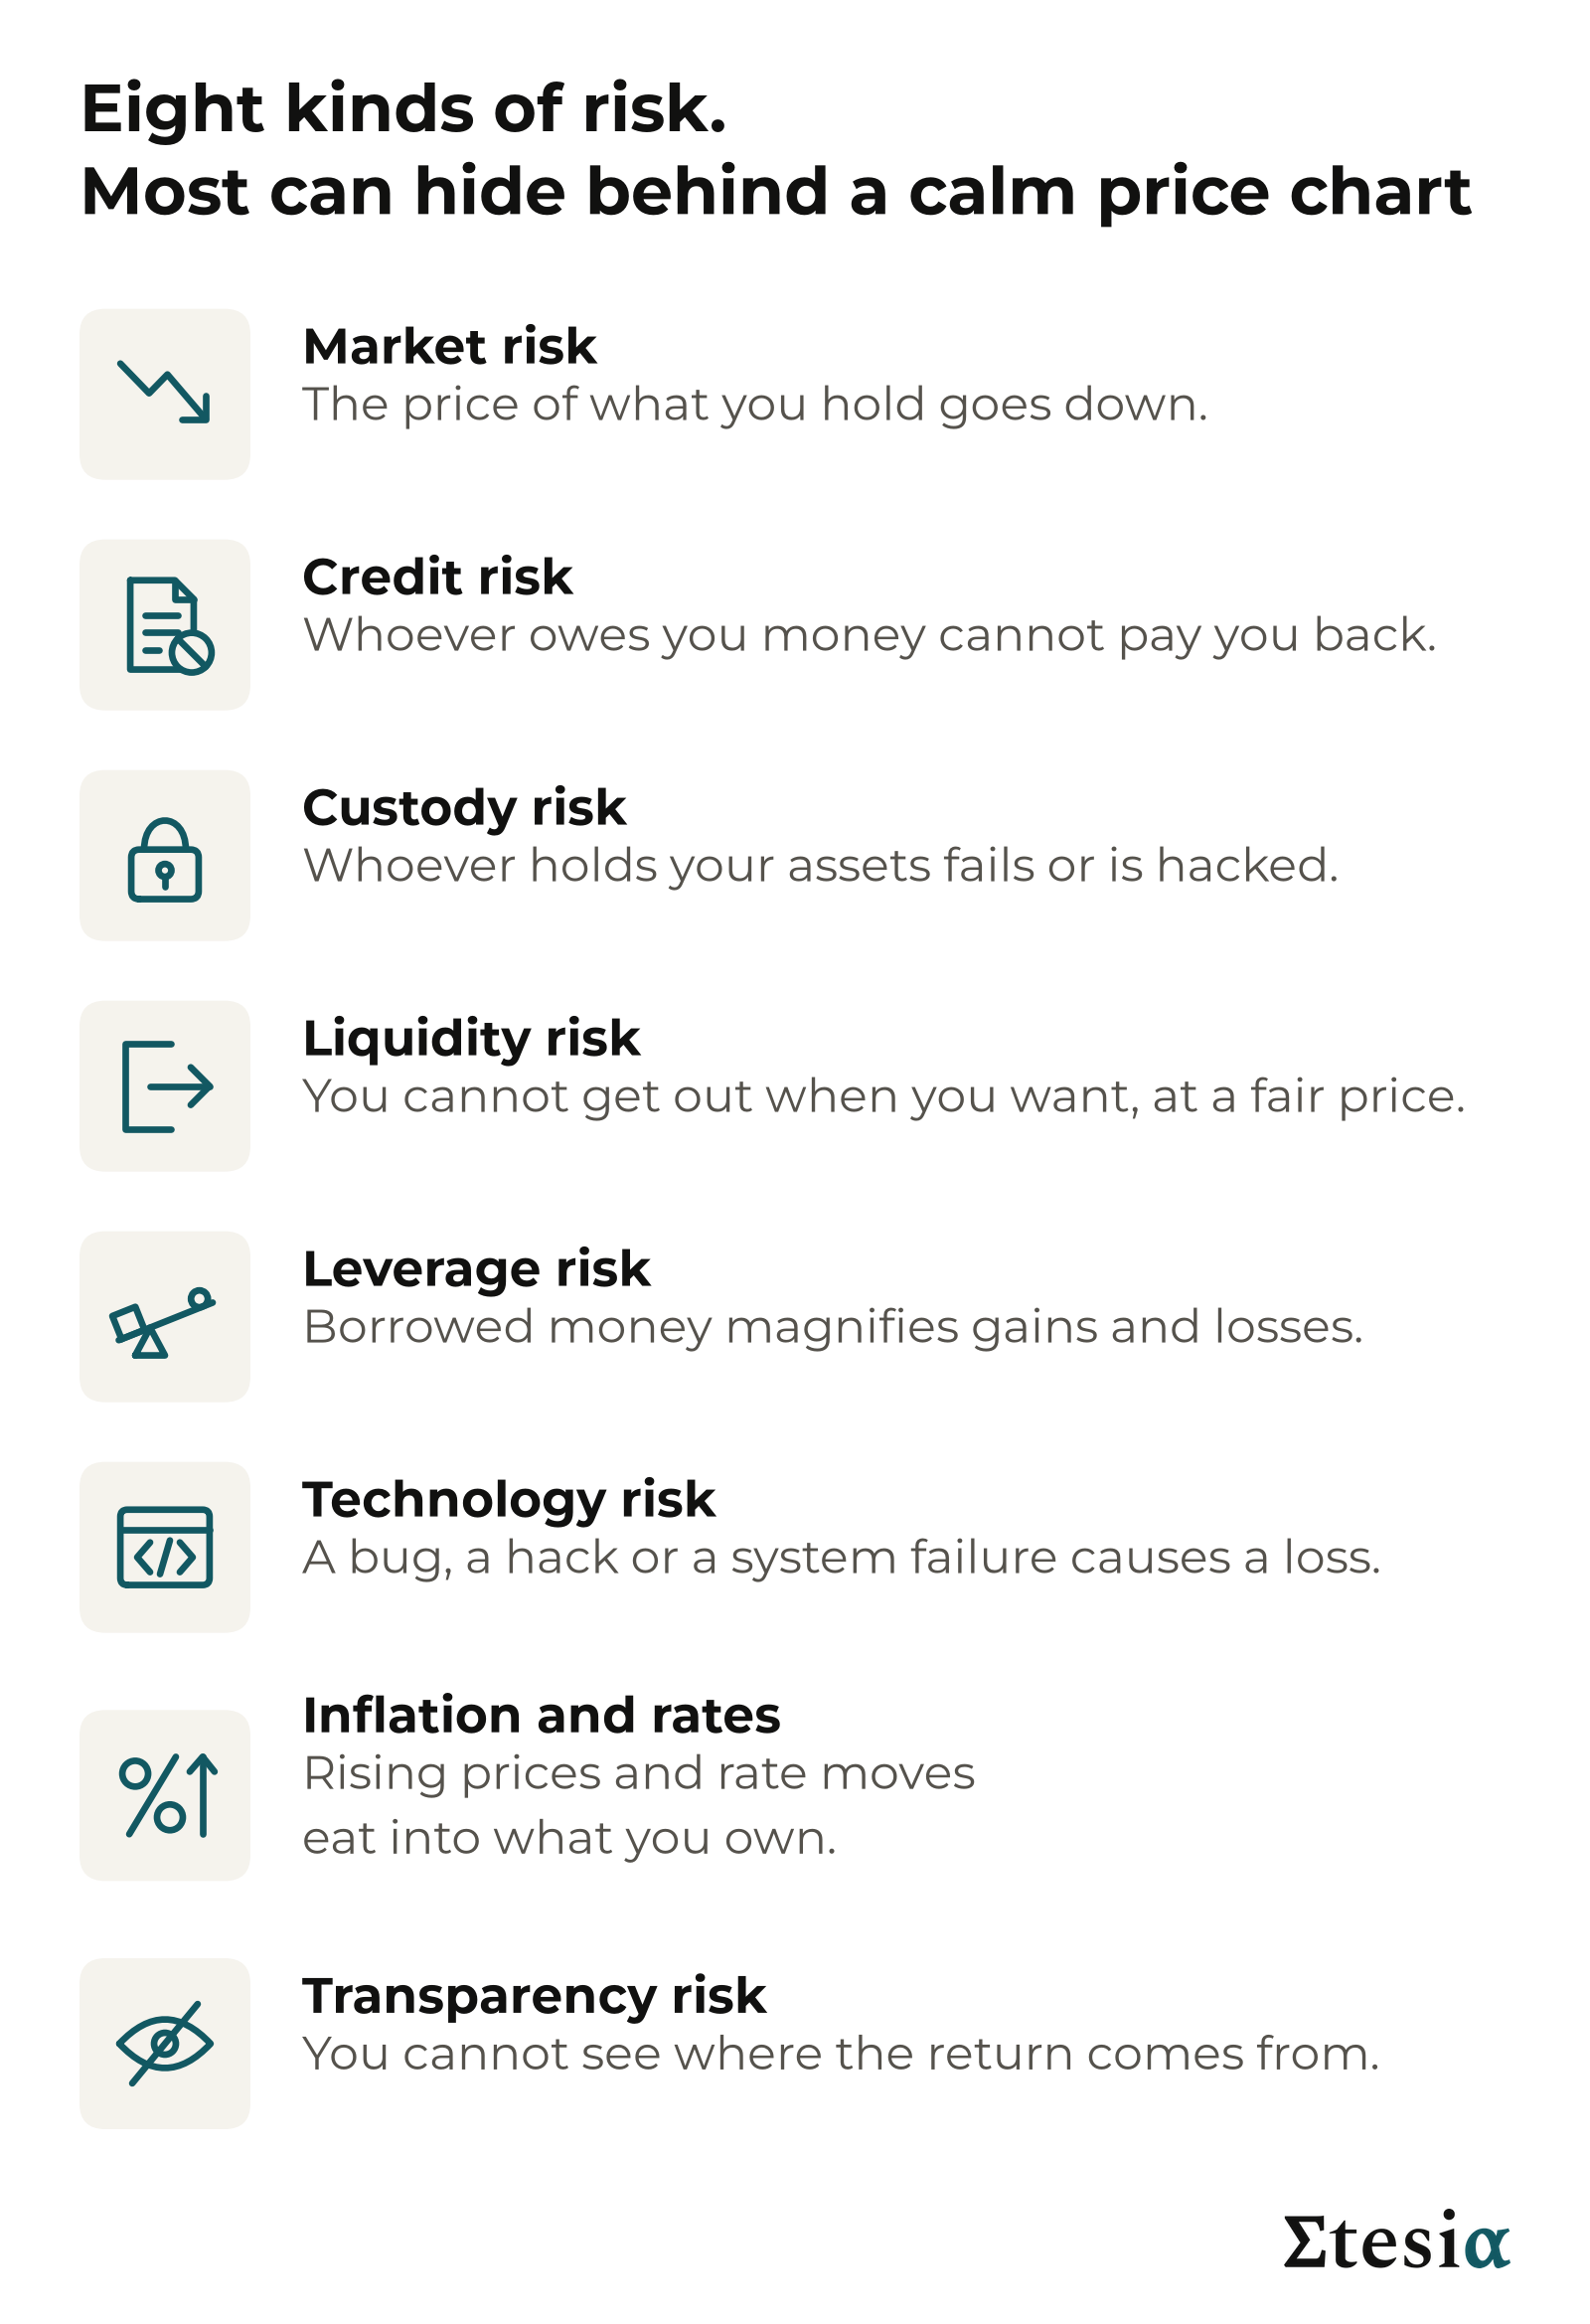
- Market risk. The price of what you hold goes down, sometimes for years. Bitcoin fell 77% between November 2021 and November 2022.
- Credit risk. Whoever owes you money cannot pay. A money market fund is used much like a savings account, and each share is meant to stay worth exactly $1.00. In September 2008 a large US one, the Reserve Primary Fund, held debt of Lehman Brothers, an investment bank that failed. The share value slipped to $0.97 and withdrawals were frozen.
- Custody risk. Someone else holds your assets, and they could fail, be hacked or misuse them. FTX, a crypto exchange (a platform for buying, selling and storing coins), went bankrupt in November 2022 after customer money was taken and used by a related trading firm. Most customers waited more than two years to be repaid.
- Liquidity risk. You cannot sell or withdraw when you want, or only at a much worse price. After the UK’s 2016 vote to leave the EU, six property funds holding about £14.6 billion suspended withdrawals: buildings cannot be sold in a day.
- Leverage risk. Leverage means investing with borrowed money. Put in 1,000 of your own and borrow 1,000 more. If what you bought falls 10%, you have lost 200, which is 20% of your own money.
- Technology risk. Bugs or hacks cause losses that have nothing to do with markets. In March 2023 an attacker found a flaw in Euler, a crypto lending service run by computer code, and took about $197 million. In that case the funds were later returned.
- Inflation and rates. Rising prices shrink what your money buys, like a slow puncture. When interest rates rise, new bonds pay more, so older bonds that pay less become worth less. US inflation reached 9.1% in June 2022, interest rates rose fast, and a broad US bond index lost 13% that year.
- Transparency risk. You cannot see where the return comes from, who is in charge, or which rules protect you. Bernard Madoff reported smooth, steady gains for decades. The trades were invented, and so was most of the $64.8 billion shown on client statements.
Takeaway: a smooth chart is not proof of low risk.
A tour of seven kinds of investment
Savings and cash. The bank pays interest because it lends your money on. If it fails, a national guarantee scheme covers deposits up to a limit (€100,000 in the EU, £120,000 in the UK, $250,000 in the US). Money market funds have no such guarantee: the one in the credit example lost 3%. The quiet risk is inflation, when prices rise faster than your interest.
Bonds. You lend to a government or a company, which pays interest and, unless it fails, returns the loan at the end. A broad bond fund can lose more than 10% when interest rates rise fast.
Stocks. You own a slice of real companies and share in their profits. A bad year can cost a quarter to a third of your money, and twice since 2000 the main US index has roughly halved.
Real estate. Tenants pay rent and buildings may rise in value. Property is usually bought with borrowed money and is slow to sell, so losses are magnified and you may be unable to get out.
Hedge funds. A manager trades your money, often with borrowed money, and keeps part of the gains as fees. Funds differ enormously, strategies are often undisclosed and money can be locked in for a year or more.
Crypto. No interest, rent or profit stands behind a coin: you gain only if someone later pays more than you did. The price can rise or fall by half in an ordinary year, and Bitcoin has lost roughly 75 to 85% of its value three times since 2013.
Crypto yield. Lending platforms, staking (locking up coins to help run a network) and products built on stablecoins (coins meant to stay worth one dollar) can pay a yield: a regular income, quoted as a percentage per year. It comes from borrowers, from rewards paid by the network or from newly created coins handed out as a bonus, and it is not always clear which.
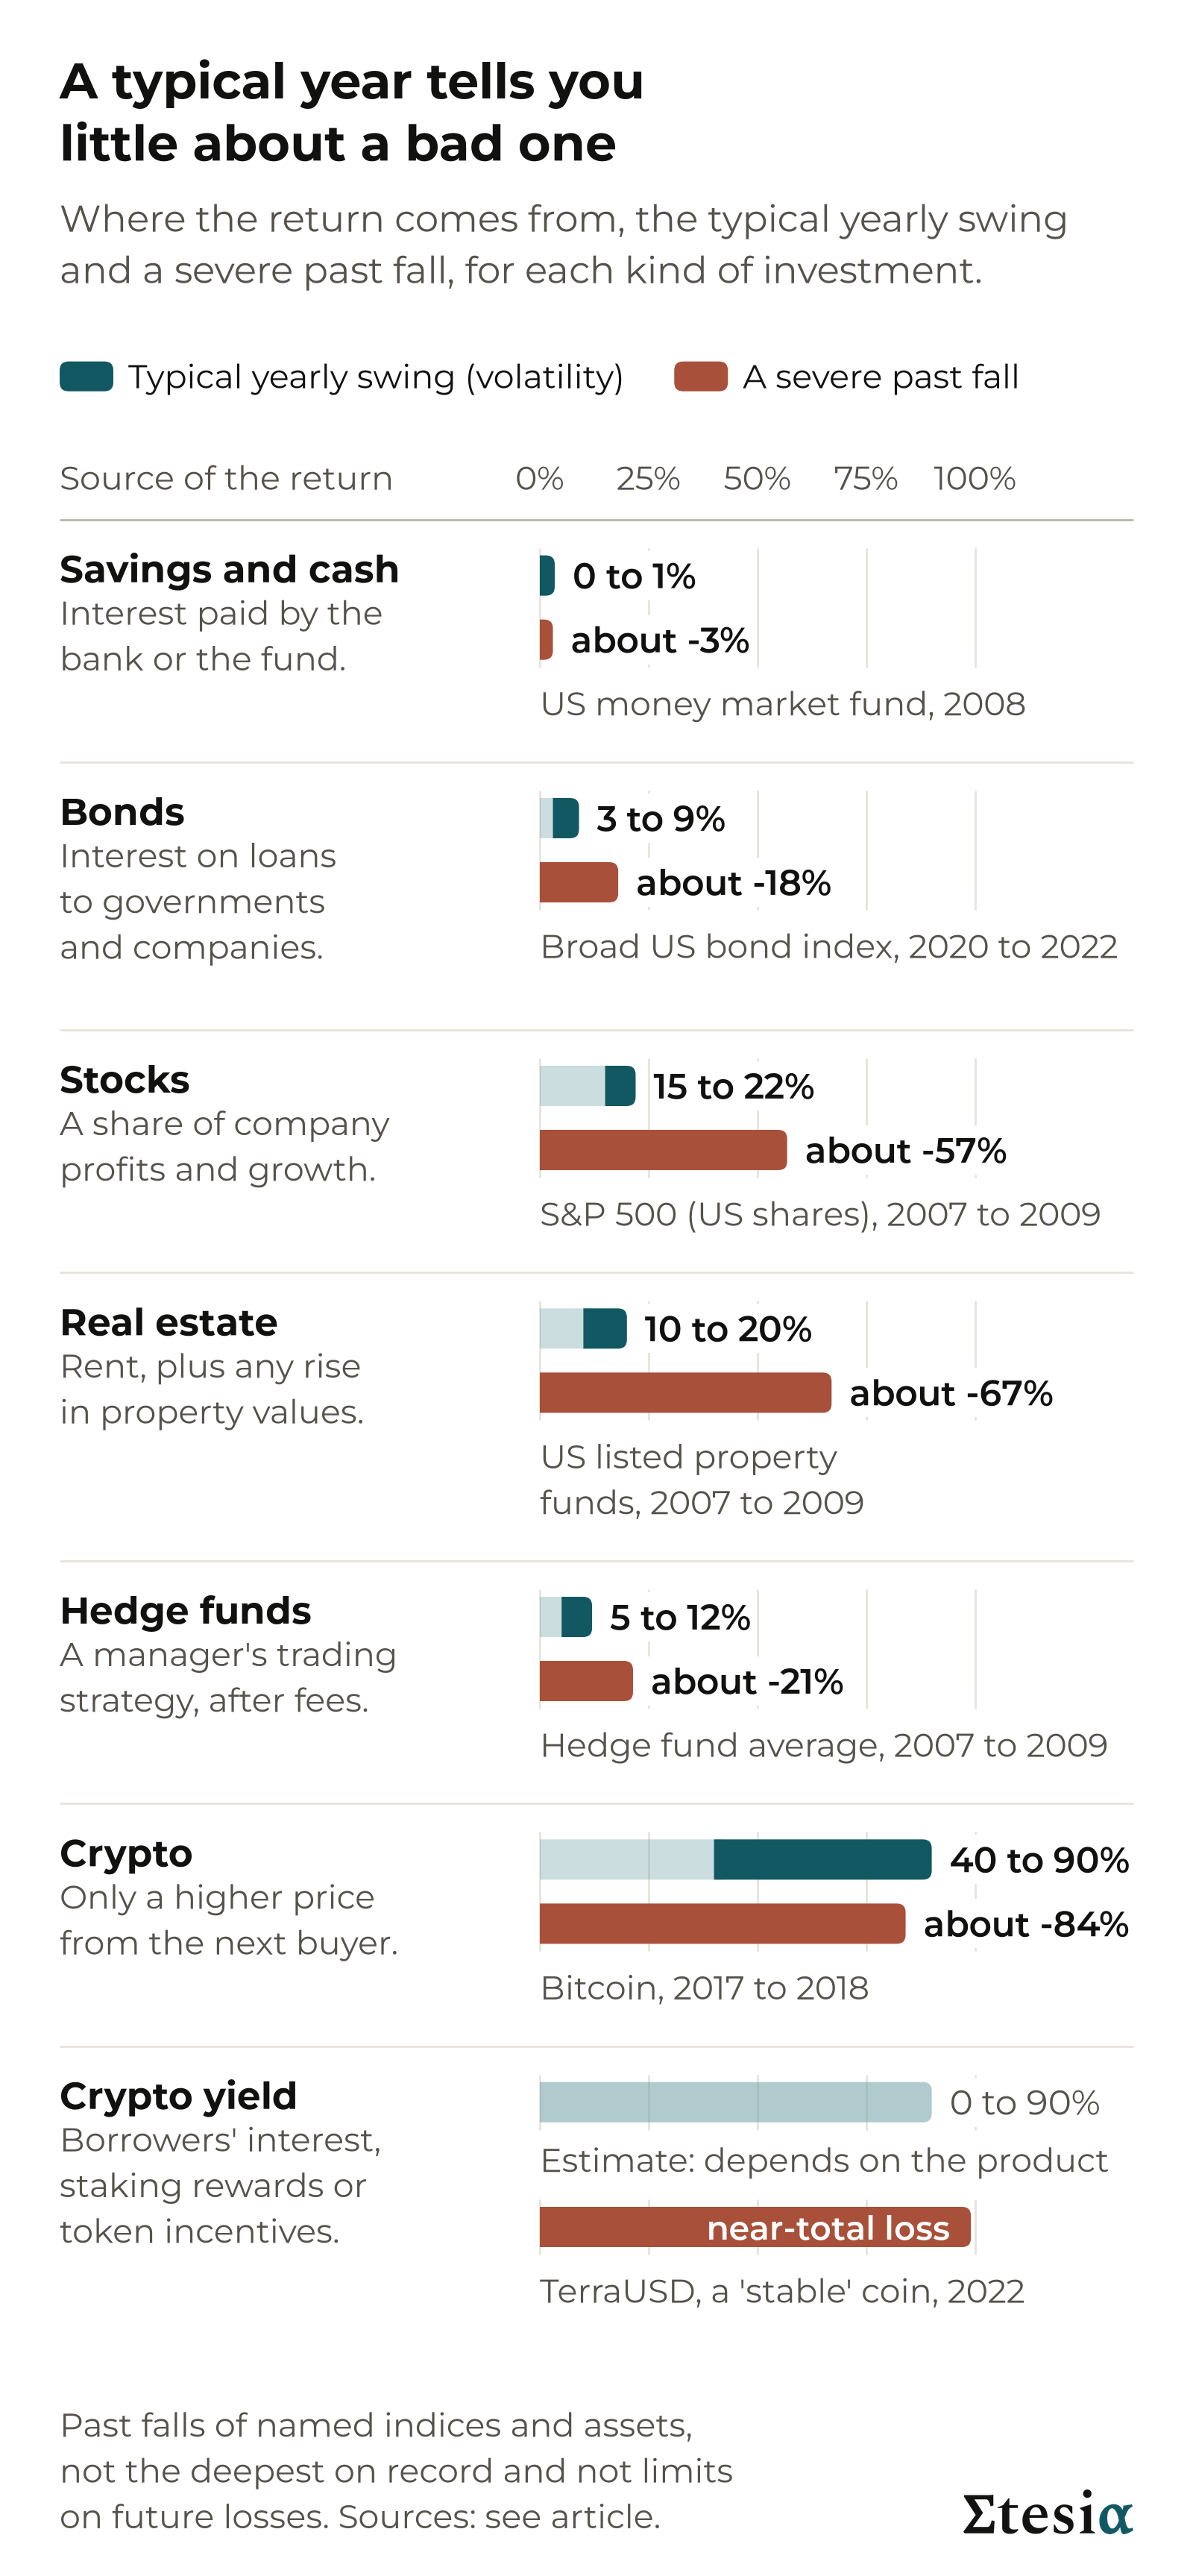
These falls are reference episodes, not the deepest on record: US shares fell 86% between 1929 and 1932, Bitcoin fell by more than 90% in 2011, and single shares, funds and coins have gone to zero.
Takeaway: each investment swaps one set of risks for another. None is risk-free.
Yield is never free
A yield above the savings rate is a payment for carrying a risk. The higher the figure, the harder you should look for the risk behind it.
A product called Anchor advertised up to 20% interest on TerraUSD, a stablecoin. In May 2022 the coin and its sister coin fell to close to zero, and at least $40 billion of market value was lost. The lending platform Celsius advertised up to 18%, froze withdrawals in June 2022 and went bankrupt a month later, owing customers about $4.7 billion.
In both cases calm prices gave no warning. The risk was in how the product worked and what was done with the money.
Takeaway: if you cannot name the risk behind a yield, you are still carrying it.
Five questions before you invest
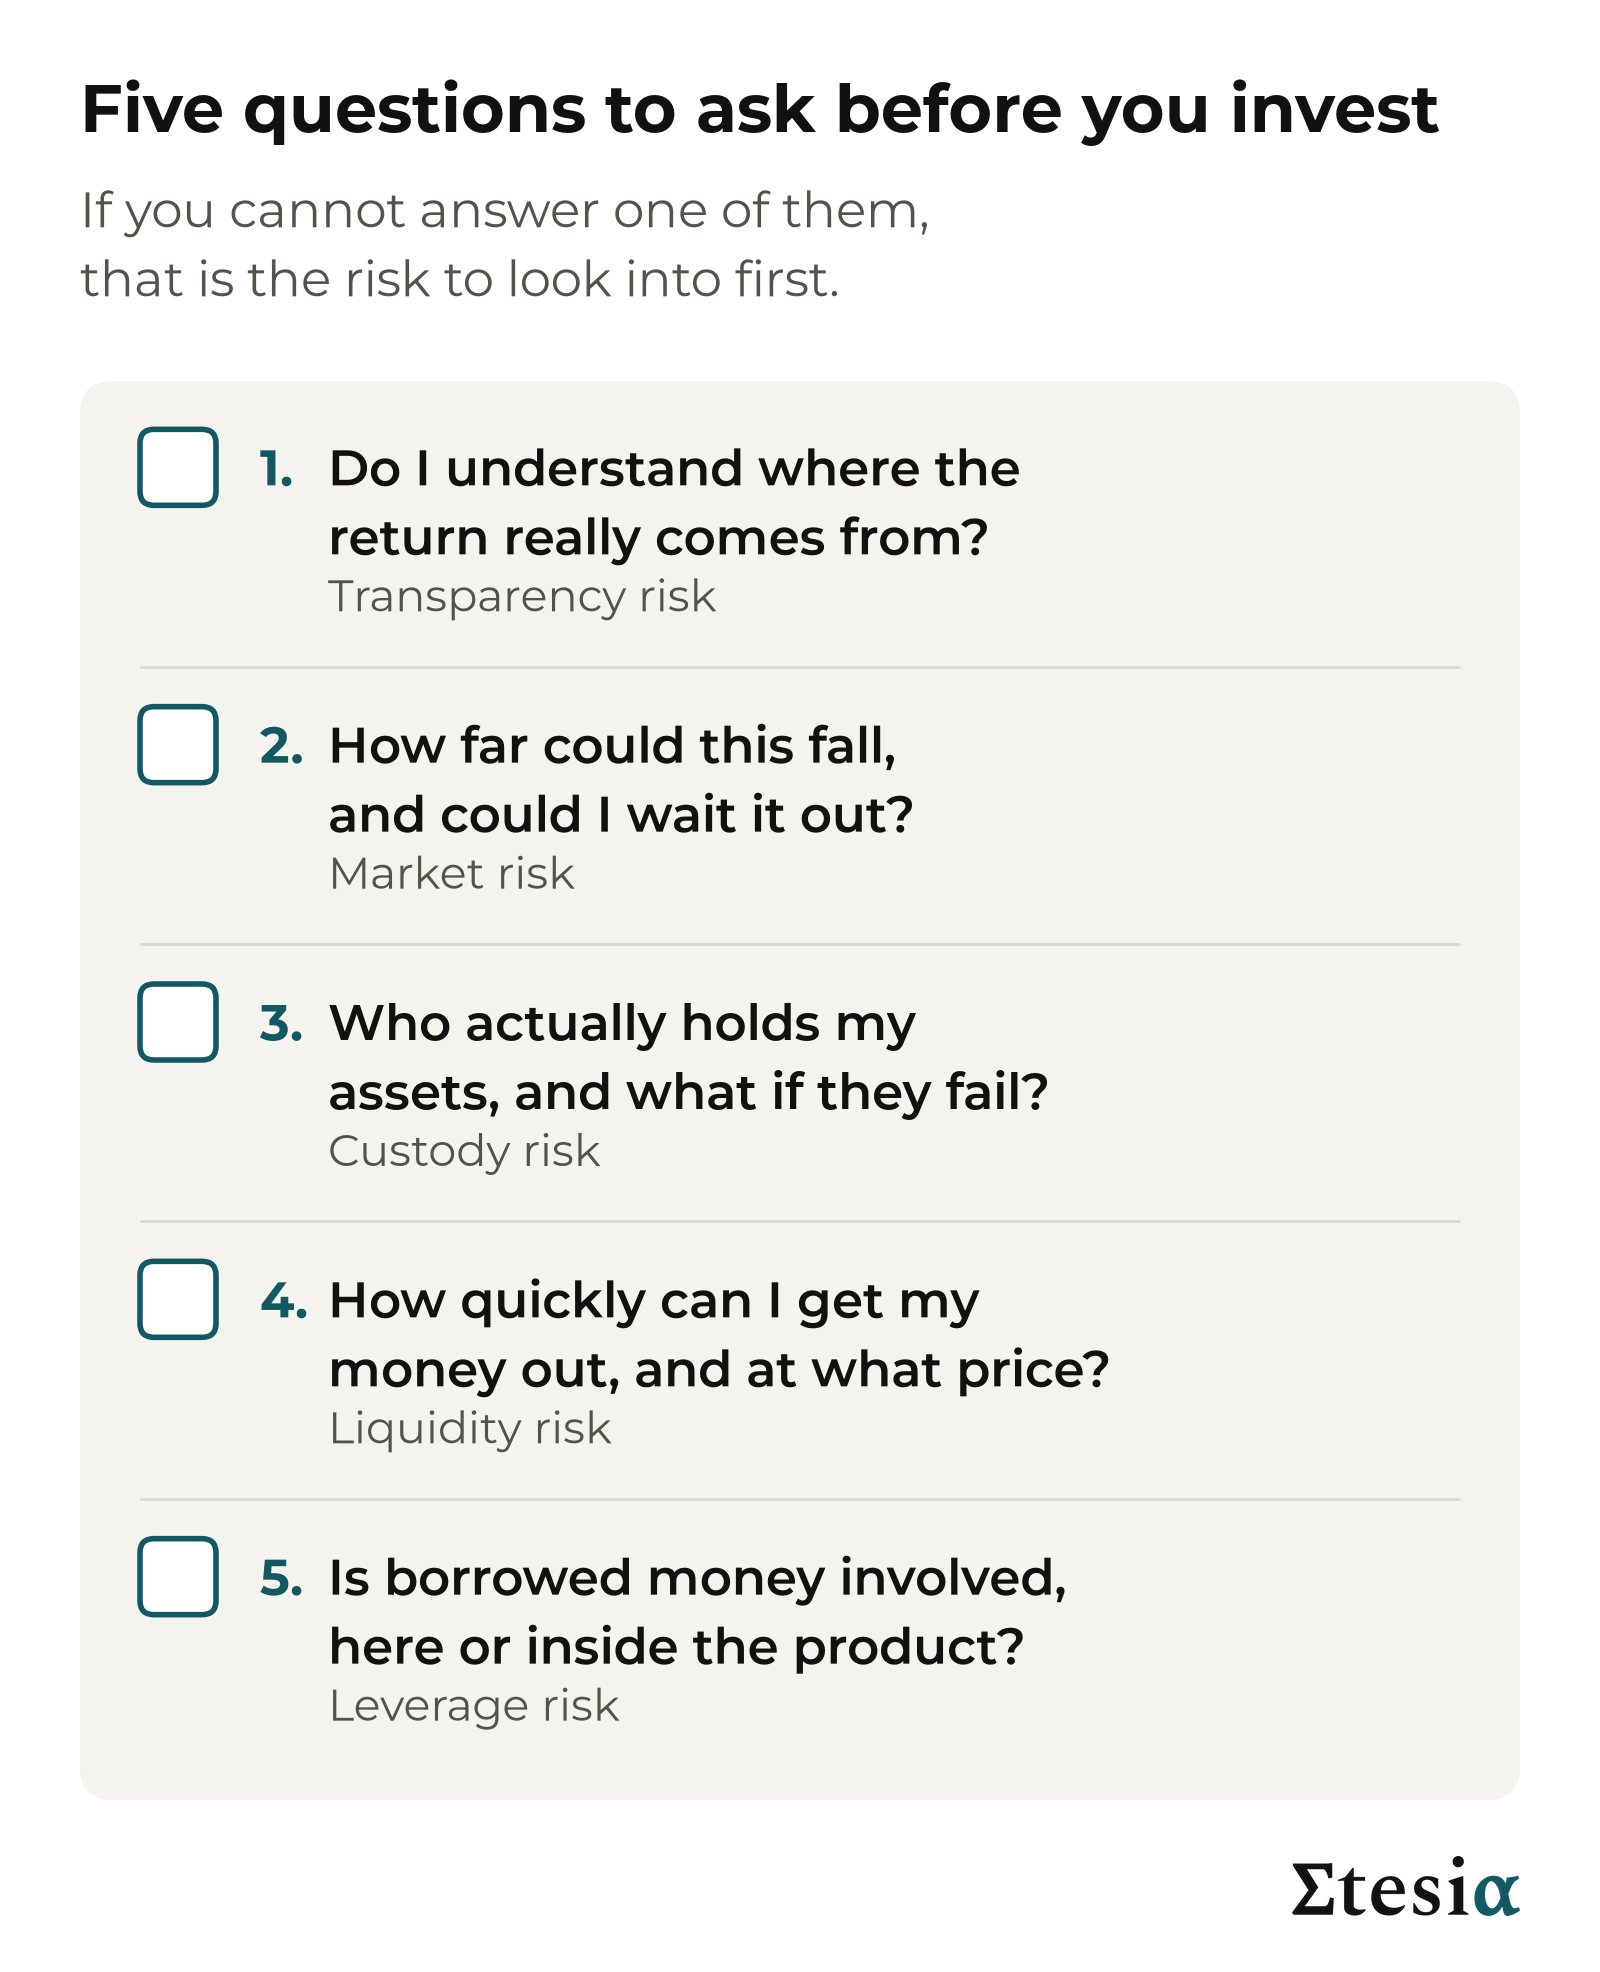
- Do I understand where the return really comes from?
- How far could this fall, and could I wait it out?
- Who actually holds my assets, and what if they fail?
- How quickly can I get my money out, and at what price?
- Is borrowed money involved, here or inside the product?
A clear answer to each does not make an investment right for you. A missing answer is a warning.
Takeaway: you do not need a formula to assess risk. You need five answers.
How Etesia thinks about risk
Etesia runs trading strategies that follow fixed rules. Client assets sit in on-chain vaults: pools held by computer code on a public blockchain (a shared record that anyone can inspect), not in an account at Etesia.
We set the risk first, as two numbers.
The first is volatility. Today we target 15% a year, the bottom of the range for stocks on the chart of yearly swings above. That describes the size of the swings we aim for, not the kind of risk.
The second is drawdown. We calibrate our risk so that drawdowns are designed to stay within 15%, a fall that needs a gain of about 18% to recover.
Both are targets the system is built around, not guarantees. A real fall can go beyond its target, so we watch drawdown continuously.
On questions 3 and 5: the vault holds the assets, so Etesia does not. We can trade them under strict limits but never withdraw them. That changes the custody question without removing it: you rely on the vault’s code and on the trading venue. The strategies trade derivatives (contracts that follow an asset’s price), which work like investing with borrowed money, so leverage is part of the product.
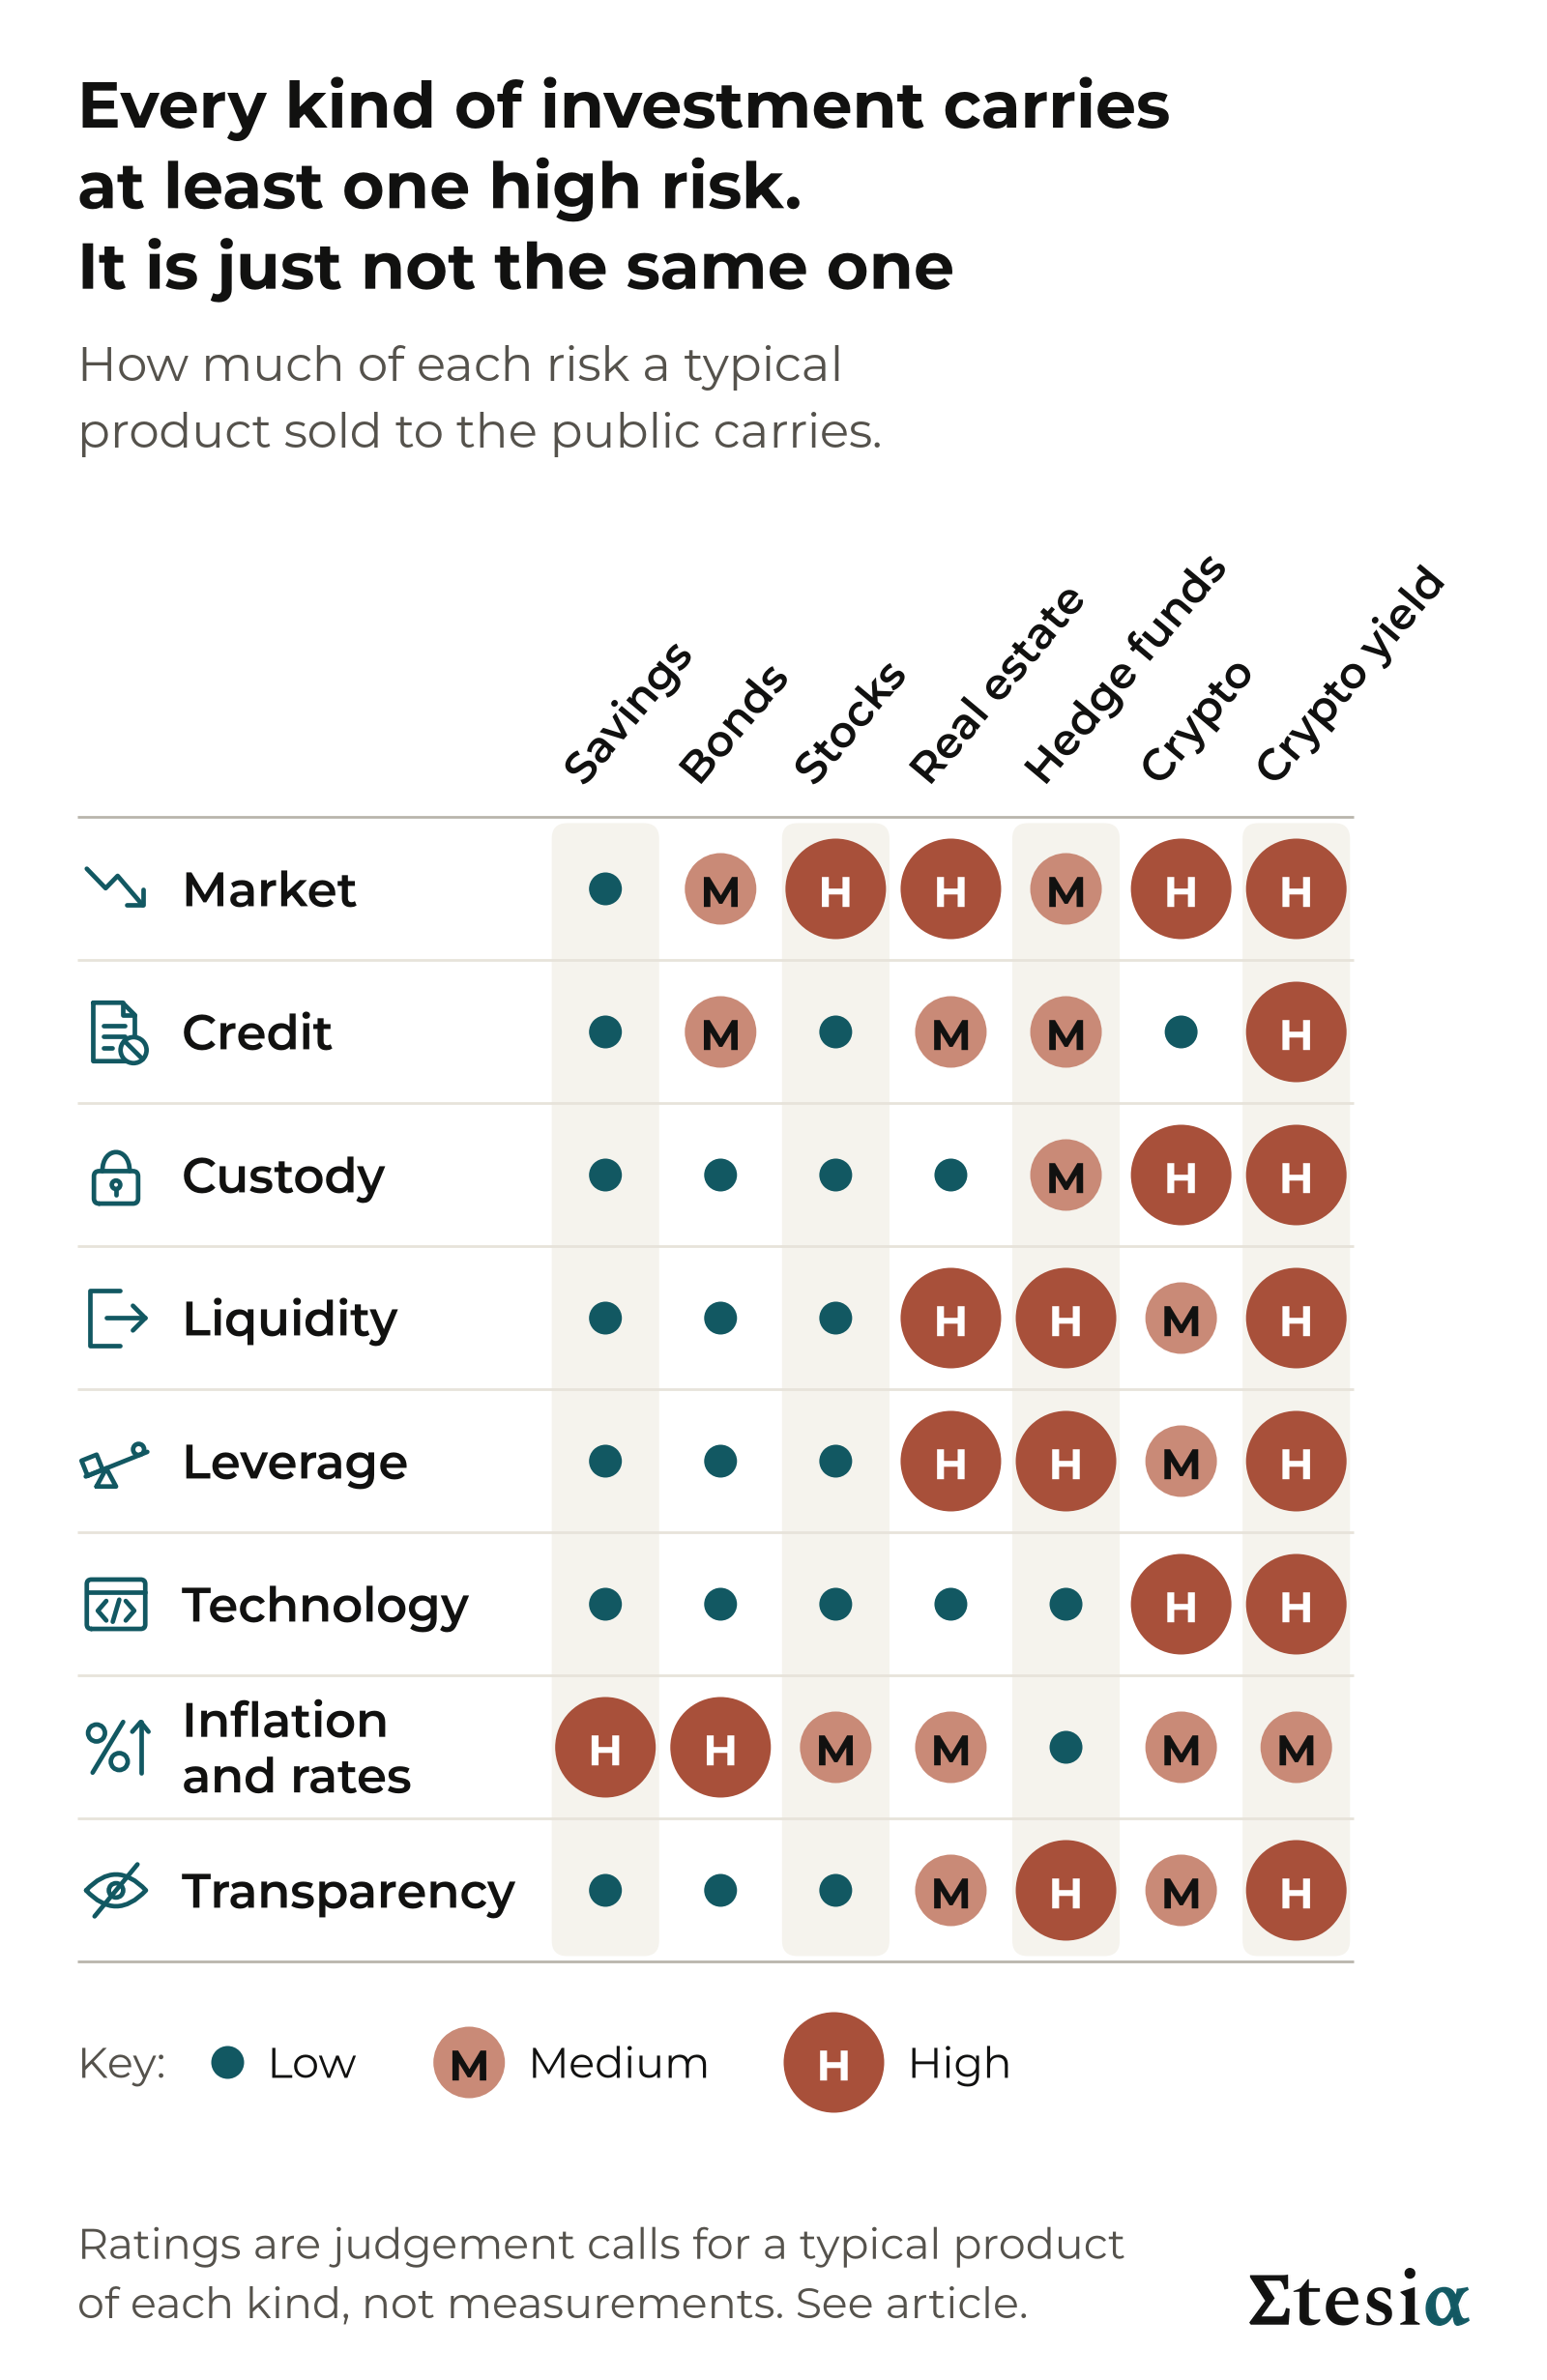
Rated the same way as the risk map, in our own judgement, the vaults are high for technology, medium for market, credit, custody and leverage, and low for liquidity (you can withdraw at any time), for inflation and rates, and for transparency (deposits, trades and withdrawals are public on the blockchain).
Takeaway: a risk target is a statement of intent, not a promise.
Before you put money into anything, ours included, put the five questions to it. If an answer is missing, keep asking until you have it.
Next in this series: how to compare return with risk, using a measure called the Sharpe ratio.
Sources
The figures in this article come from public sources: regulators, central banks, index providers, court records and, for crypto prices, the trade press. The main ones are listed here.
- Volatility ranges: J.P. Morgan Asset Management, 2026 Long-Term Capital Market Assumptions. The two crypto ranges are Etesia’s judgement, informed by figures from Fidelity Digital Assets and 21Shares.
- Stocks: Yardeni Research, tables of S&P 500 rises and falls.
- Bonds: the Bloomberg US Aggregate Bond Index, as reported by Bloomberg and Morningstar.
- Property: the FTSE Nareit All Equity REITs Index (US property funds traded on the stock market); Sun, Titman and Twite, 2013 (published by Nareit); UK Financial Conduct Authority, discussion paper DP17/1.
- Hedge funds: Hedge Fund Research, HFRI Fund Weighted Composite Index (an industry average); court filings as summarised by Wikipedia, and the trustee’s reports (Madoff).
- Savings: FSCS, European Central Bank and FDIC (deposit guarantee limits); US Securities and Exchange Commission and US court documents (Reserve Primary Fund); US Bureau of Labor Statistics (inflation).
- Crypto: Cointelegraph and 24/7 Wall St. (Bitcoin prices); US Securities and Exchange Commission (TerraUSD); Chainalysis (Euler); CNBC, Fortune and US regulators (Celsius); Reuters and the US Department of Justice (FTX).
The ratings on the risk map are Etesia’s own judgement, not measurements.
This article is general educational content, written as of October 2026. It is not investment advice, not a personal recommendation, and not an offer or invitation to invest in any product, including Etesia’s vaults. Etesia runs investment strategies and so has a commercial interest in this subject. All investing involves risk, including the loss of everything you invest. Crypto-related products are high risk and are usually not covered by deposit insurance or investor compensation schemes. The risk ratings are Etesia’s judgements, not measurements. Historical figures are approximate and past performance is not indicative of future results. Etesia’s volatility and drawdown figures are design targets, not results and not guarantees.
Leave a Reply